- Indico style
- Indico style - inline minutes
- Indico style - numbered
- Indico style - numbered + minutes
- Indico Weeks View
Choose Timezone
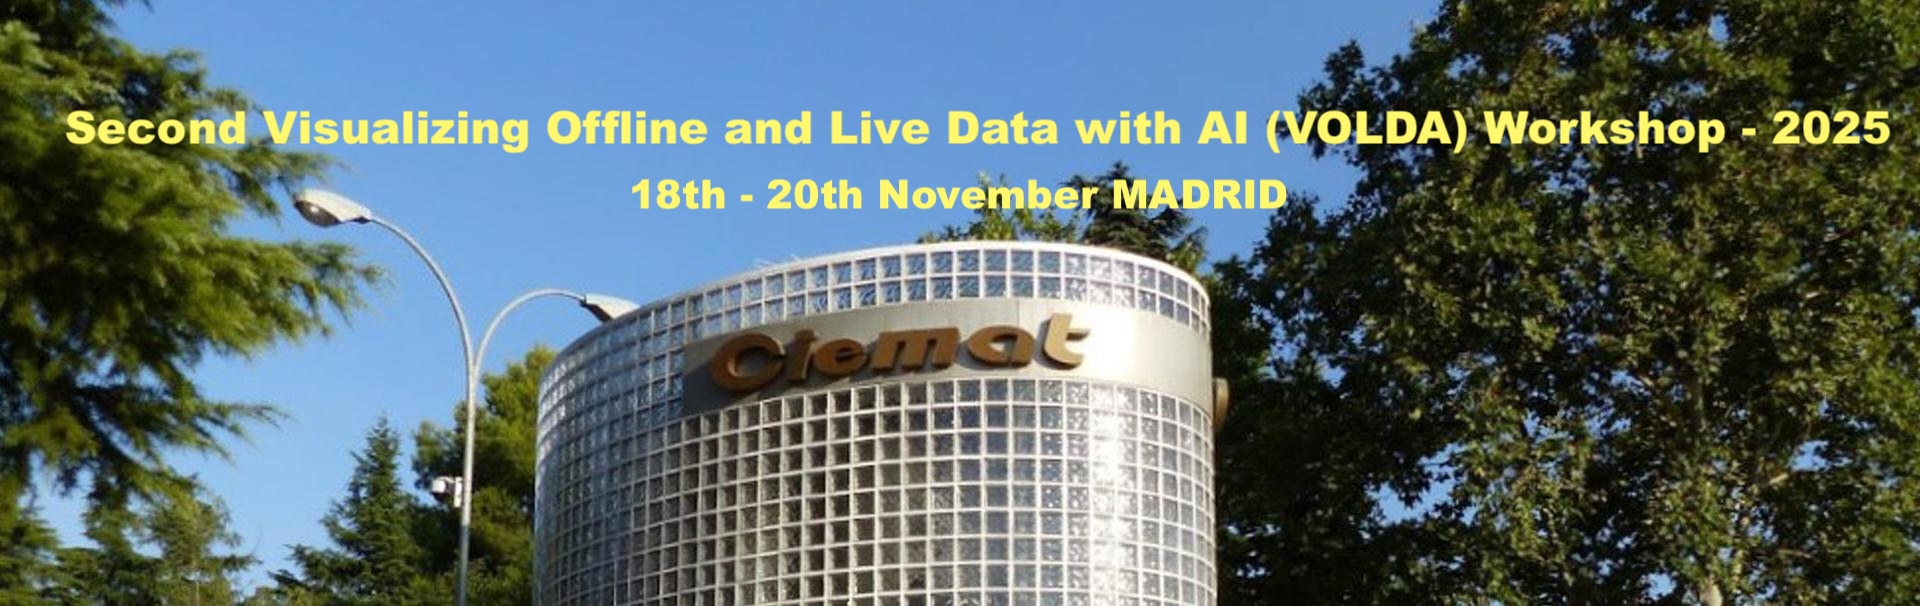
The workshop takes place at the CIEMAT Research Center, Madrid, Spain.
The workshop aims at bringing together the fusion community to discuss the challenges brought by AI and visualizing large datasets in fusion experiment and simulation.
The three days focus on feedback, lessons learnt and innovative techniques that developers and users experience with AI techniques and visualizing large datasets.
A summary of the workshop and individual contributions will be published in Frontiers in Physics.
VOLDA 2025 is partnering with Frontiers in Physics, an Open Access multidisciplinary journal. A Research Topic will be launched, aiming to collect feedback, lessons learned, and innovative techniques based on the Workshop discussions. Research Topics are peer-reviewed article collections directed and handled by guest editors - a wide variety of article types can be submitted, including Original Research, Review, and Perspective. For further guidance on how to submit articles please see our Submission Checklist here
The workshop takes place at the Sala B (Santiago Ramón y Cajal, Second floor, Room P2.58), Building 1, CIEMAT.
Deadline for abstract submission : August 31st, 2025
The Tokamak Systems Monitor (TSM) is a software suite under development at ITER that provides operators with an integrated view of the tokamak’s engineering health based on operational instrumentation. A key functionality of TSM is anomaly detection, aimed at identifying unexpected behaviors across a wide range of systems. To this end, a dedicated anomaly detection module is being developed to integrate multiple machine learning-based algorithms, ranging from intershot classification of complete pulses to online detection of localized events. The current status of this module and its roadmap for future development are illustrated with two implemented examples: an intershot algorithm that uses dimensionality reduction and clustering to classify gyrotron pulses, and a time-localized approach based on an invertible neural network to monitor magnet power supplies. Automated warnings generated by the module will support operators in evaluating anomalies, thereby enhancing the reliability of ITER operations.
The stability control of neoclassical tearing modes (NTMs) is critical for achieving high performance steady-state operation in future magnetic confinement fusion devices. Active suppression of seed magnetic island formation represents a key early intervention strategy to minimize the cost of NTM control. This study addresses the critical threshold problem of NTM seed magnetic island triggering in the EAST tokamak, proposing a supervised learning-based temporal prediction framework to identify key triggering parameters and quantify their abrupt transition characteristics. By integrating diagnostic signals (e.g., Mirnov probes, soft X-rays, electron cyclotron emission ECE) and inversion parameters (βp, q profile), a multimodal temporal database (time resolution ≤1 ms) containing magnetic island width evolution is constructed, focusing on capturing trigger event labels where magnetic island width exceeds 2 cm. Using a hybrid deep network (HDL) and LightGBM algorithm with physics-informed feature engineering, the following objectives are achieved: 1) Establishing a correlation model between magnetic island trigger thresholds and βp/ne, validating experimentally observed critical conditions (e.g., βp,onset≈0.61); 2) Revealing the dominant roles of 1/1 internal kink mode coupling strength and error field harmonic components through SHAP value analysis and feature importance ranking for 2/1 NTMs; 3) Developing cross-device adaptation strategies to generalize the model to other tokamak data, verifying universal threshold patterns of normalized parameters (e.g., βN/q95). Experimental validation demonstrates high-precision prediction (AUC >0.91 with ≥20 ms warning window) on EAST historical data, showing consistency between key parameters (magnetic island growth rate, soft X-ray fluctuation amplitude) and theoretical/simulation results. This research provides a data-driven theoretical tool for analyzing NTM triggering mechanisms and active avoidance strategies in ITER and future fusion reactors.
EAST facility aims to support high-performance steady-state operation. EAST data acquisition system has been established to provide unified data acquisition and long-term data storage for various diagnostic systems, which is for offline data analysis. With the use of technologies such as digital twin and artificial intelligence, the demand of real-time data access in long-pulse operation is urgent. The exploration aiming at long-pulse real-time data publishing within the framework of EAST data acquisition system is ongoing and a prototype system has been established. The prototype system adopts ZeroMQ to transfer data. The DAQ unit acquires diagnostic data in real-time and transmits the data in time-sliced data format to the server with request/reply pattern. The server immediately publishes the data with publish/subscribe pattern and stores the data for long-term storage. Users which subscribe to signals can obtain real-time data for data visualization or data analysis. Tests are currently underway.
The Tokamak Systems Monitor (TSM) is a comprehensive monitoring and diagnostic framework developed in collaboration with Industry and supported by ITER, F4E, and U.S. partners. Designed to support tokamak operations from integrated commissioning onward, TSM integrates global machine models with real-time sensor data to assess system health, monitor component lifetimes, and detect anomalies.
TSM includes a suite of reconstruction algorithms—electromagnetic, structural, thermal, and thermomechanical—that enable detailed analysis of structural behavior under operational conditions. Anomaly detection capabilities are being enhanced through machine learning, with a focus on early detection of failures, inspection and unplanned maintenance.
The system architecture features two distinct Human-Machine Interfaces (HMIs): one dedicated to the configuration and execution of monitoring algorithms during operations, and another focused on intershot and offline data analysis. This presentation explores the strategy adopted for the latter, detailing the design rationale, prototype developments completed as part of the Preliminary Design phase, as well as their driving requirements and objectives.
Finally, the presentation evaluates the three implementation paths considered for the Data Analysis HMI—developing a dedicated modular application, building on existing monitoring platforms, or leveraging the tool of choice for Scientific Data Analysis—and presents the decision and rationale for moving forward onto the Final Design stage.
MDSplus is a suite of tools for data acquisition and analysis; one of these tools is an interactive data visualization tool. The webScope project aims to modernize our visualizer’s capabilities using web-based technologies. Currently, MDSplus offers two visualization tools, which are showing limitations as they age and as computing expectations have evolved since they were first written. We intend to consolidate the features from the data visualization tools and provide a modern platform that can be extended with new functionalities.
WebScope aims to be fast, portable, lightweight, and easily maintainable.
* Fast: Webscope uses websockets: a single connection is made and maintained for requests to the server, eliminating the need to reopen a tree with each new request.
* Portable: web browsers are ubiquitous. Real-time monitoring can be made more convenient by enabling access to the wide range of modern devices that have them.
* Lightweight and maintainable: webScope is written using vanilla JavaScript with as few additional packages as reasonable, reducing breakable dependencies.
As the MDSplus user base has grown, so has demand for web-based tools. The native web-based architecture of webScope provides modern creature comforts right out of the box: display scaling for modern screen resolutions, whole-screen zooming, plugins for dark mode, and more.
The web-based platform also creates myriad possibilities for future added functionality: zoom history to allow users to quickly reset the view, highlight sections of a trace to focus the viewers' attention--especially useful for presentations and papers, and integration into a suite of Web applications such as an electronic notebook.
HDF5 is an excellent storage system for collecting large amounts of scientific data but using it to collect real-time data from multiple sensors can be a challenge since the HDF5 library doesn't support multi-process writers. HSDS (HDF5 Scalable Data Service) enables the HDF5 data model to be accessed over the network using REST-based HTTP requests and enables simultaneous connections from any number of clients.
In this session, I'll demonstrate how HSDS can be used to collect data from multiple sensor streams and display real-time data in a web application.
In this talk, I will discuss how we are using advanced visualisation and immersive technologies to make fusion data more accessible, interactive, and meaningful. Fusion facilities, operations, and research generate vast, heterogeneous, and often multimodal data from different sources such as CAD models and diagnostics, multiphysics simulations, and AI predictions etc. These huge and complex datasets need not only high-performance computation but also thoughtful design, integration, and communication. Moreover, understanding these complex systems requires more than raw computational power; it requires connecting people to data in intuitive and context-aware ways.
A modular and flexible approach for the development of interoperable and stakeholder-aware visualisation workflows is not just a requirement but a necessity. We present the Fusion Information Visualisation for Experience Design (FIVExD) framework, which is a conceptual design framework in this talk. This very framework is being used at the UKAEA for the integration of several major facilities like MAST-U, CHIMERA, HIVE, and LIBRTI, along with leading collaborative and digital twin technologies such as NVIDIA Omniverse in the OpenUSD-based automated pipelines. The workflows being developed allow for the interoperability of engineering, diagnostics, and simulation data and thus provide for the seamless visualisation of data across different disciplines and use cases.
The applications of these include the use of photorealistic and scientific digital twins that integrate CAD models, simulation outputs, and live diagnostics within immersive visualisation and collaborative environments. AI-assisted dashboards and annotation tools enhance situational awareness and streamline visualisation setup, while Omniverse powered experiences, as well as AR and VR interfaces, extend these experiences into shared, spatially aware contexts. The central goal is to develop tools, technologies, and experiences that make it easier to conduct early design reviews, plan experiments, provide training, and outreach. Thus, they do not only support the scientific community but also facilitate communication with the general public by simplifying the technical knowledge and engineering processes into human-understandable forms.
Looking ahead, efforts are focused on developing AI-driven visual agents and adaptive XR interfaces capable of dynamically tailoring visualisation to user focus, experiment state, or data complexity. The amalgamation of design engineering with supercomputing, GPU rendering, and flexible cloud services such as the OVX visualisation cluster (we are about to launch), is aimed at creating visualisation ecosystems that are not only responsive but also simple to interface and interact with. The ecosystems will form an essential link among simulation, experiment, and human insight, supporting data-centric approaches to fusion system design and optimisation through advanced visualisation.
Tokamak is a complex nuclear fusion reaction device composed of numerous systems. During physical experiments, different systems will obtain massive amounts of experimental data, which are highly specialized and require domain knowledge and specific tools to view and analyze. In addition, tokamak devices, as important nuclear fusion reaction devices, have strict management mechanisms and are not easily accessible. We develope a fusion device experimental data visualization system, based on the EAST device and using EAST tokamak experimental data, to construct a visualization system framework and basic platform. Three kinds of data visualization are integrated into the virtual platform: magnetic topology data, electromagnetic measurement data, and real time plasma shape data. In the processing of plasma physics experiments, real-time visualization of these data can help researchers capture key information in a timely manner and assist in scientific decision-making. Directly displaying intangible physical parameters in a proportional virtual device helps physicists understand fusion systems and also determines the operating status of the device through various diagnostic data. 3dsMax is used for modeling and processing, Maya is for model animation production, Unreal Engine 5 engine is for rendering, particle effects production, packaging, and publishing into cloud rendering mode through WebRTC protocol, achieving lightweight access to B/S architecture. The system has implemented the entire process of data collection, data cleaning, data storage and data transmission. In the future, more diagnostic data will be visualized in this system, and more efficient ways of data processing will be summarized using this system.
One of the main obstacles to the propagation of ASCR-funded high-performance computing (HPC) libraries (e.g, MPICH, OpenMPI, Kokkos, Legion, RAJA) is the challenge posed by performance optimization of application codes that run on heterogeneous architectures at scale. A visual, interactive and intuitive tool to guide users through the execution of the application and highlight areas of interest, thereby helping to save both developer and compute time, as well as electricity, is thus of utmost importance not only to DOE but also to the commercial “tech” sector at-large.
We proposed to develop the “WorkVisualizer,” a browser-based application integrating informative visualization to coarsen up a level of abstraction over the fine granularity of trace-based profiling (e.g. like the Projections tool) and support users who run at large scale. At this stage, we concretized the design and built the WorkVisualizer on three pillars:
(a) Collection: leverages Caliper (Lawrence Livermore National Laboratory) via a custom configuration to collect program data without requiring changes to source code for MPI+Kokkos apps.
(b) Analysis: calculates high-level summary information and cross-rank time segmented information to determine how the application can be optimized.
(c) Visualization: provides a variety of interactive visualizations that offer actionable insights into the structure and execution patterns of the application.
In particular, we have developed and made public an open-source proof-of-concept of the proposed functionality tested on small-scale, CPU-only data up to a few hundred ranks.
Still under active development, the WorkVisualizer, by facilitating the performance optimization of high-performance libraries on heterogeneous computing platform, the WorkVisualizer could lead to faster advancements in key scientific and engineering domains.
The goal of this presentations is thus to two-fold: firstly, to illustrate the current state of the WorkVisualizer and the capabilities it already demonstrates; secondly, to discuss considered further developments and receive feedback from the audience in this regard.
Abstract:
The realization of fusion reactor from present Tokamak possess multiple challenges. Creating a virtual Tokamak via digital-twin technology offers a promising solution, but is much more than usage of parallel computation alone. A comprehensive data-processing framework must include diverse inputs, i.e. from experiment/simulations to diagnostics and seamlessly integrate them into a real model.
Building on this foundation, our paper presents a digital twin framework [1] for the Aditya Tokamak [2] that enables volumetric visualization of plasma within its vacuum vessel. As a virtual replica of the physical system, the digital twin serves as a unified platform, integrating engineering design, scientific analysis and simulated/experimental data. The system should be interactive enough to navigate through in-vessel geometry to inspect plasma behaviour, perform quantitative analyses and capture temporal snapshots at chosen time points.
Comparative analysis of several graphics‐compute frameworks are evaluated to pinpoint the most effective platform. By integrating synthetic plasma datasets into the selected framework, we employ GPU-accelerated volumetric ray-marching alongside surface-based rendering in a three-dimensional environment, rendering the plasma as a smooth, colour-mapped volume inside static CAD model. In future, we plan to train AI and machine‐learning models on advanced physics solvers to accelerate the entire simulation-to-visualization workflow.
Turbulent transport in magnetically confined plasmas remains one of the most challenging phenomena in fusion energy research, driven by micro-instabilities that degrade confinement and operational performance. Gyrokinetic simulation codes, such as GKW (Gyrokinetic Workshop), are essential for studying these effects but produce highly complex, multi-dimensional datasets - often in the order of gigabytes to terabytes per timestep - on transformed grids aligned with magnetic field lines. This complexity makes intuitive visualization and rapid data exploration a significant barrier for scientists.
In this work, we present UKAEA’s efforts to develop accessible, high-performance visualization workflows for gyrokinetic data, leveraging state-of-the-art HPC platforms and modern visualization toolchains including ParaView, Blender, and NVIDIA Omniverse. Our approach focuses on enabling scientists to interactively explore multivariate simulation outputs quickly and effectively, transforming raw 5D data (three spatial and two velocity dimensions) into meaningful representations that support discovery and insight. By integrating advanced rendering techniques with scalable computing infrastructure (e.g., NVIDIA OVX), we aim to deliver workflows that serve diverse end products - from high-impact imagery and videos to immersive, interactive experiences - while maintaining scientific accuracy.
This work demonstrates how combining HPC capabilities with cutting-edge visualization frameworks can redefine how researchers interact with gyrokinetic simulations, accelerating analysis and fostering new understanding in fusion plasma physics.
This report focuses on technological innovations in visualization within magnetic confinement fusion research, systematically elaborating on the groundbreaking applications of cinematic dynamic simulation, extended reality (XR) interaction, and intelligent 3D reconstruction in device modeling, theoretical demonstration, and scientific communication.
Based on high spatiotemporal resolution physical simulation data from the EAST tokamak, the research team constructed a movie-quality visualization of the formation process of boundary instabilities in the advanced operation mode (I-mode). This achievement (Symplectic Structure-Preserving Particle-in-Cell Whole-Volume Simulation of Tokamak Plasmas to 111.3 Trillion Particles and 25.7 Billion Grids) was successfully shortlisted as a finalist for the 2021 Gordon Bell Prize (only six global entries were selected) and presented at the virtual Supercomputing Conference (SC21) in St. Louis, Missouri, USA.
In terms of visualization-assisted fusion research, the team developed a 3D reconstruction algorithm based on parallel computing results, extracting the structure of weakly coherent modes (WCM) in I-mode and the filamentary structure of edge-localized modes (ELM) in H-mode. Through a series of mappings and dimensionality reduction techniques that preserved key information, the team successfully rendered these models in XR headsets, enabling scientists to intuitively compare the differences between the two instability structures and closely observe the simulation results.
In the field of engineering visualization, the team focused on the "Keda Torus Experiment" (KTX) device, establishing an intelligent conversion system from CAD drawings to lightweight 3D models. By employing an adaptive mesh simplification algorithm based on geometric feature recognition, the model's face count was reduced to 1% of the original data while maintaining solenoid winding topological accuracy (error < 0.05%). This optimization reduced single-frame rendering loads to within the acceptable latency threshold for Quest 3 headsets. Additionally, the team innovatively developed a cross-platform, multimodal interaction system supporting collaborative work between Vision Pro and Quest 3 devices, with multi-user synchronization latency controlled below 50ms. Using 3D Gaussian Splatting technology, a laboratory-grade digital twin system was constructed, accurately replicating the KTX laboratory at the University of Science and Technology of China (USTC) in virtual space. This provides a high-fidelity platform for future remote experimental rehearsals.
Understanding plasma behavior throughout the entire duration of a pulse is critical for achieving the objectives of ITER and future fusion devices. Plasma parameters such as temperature, density, current profiles, and impurity content evolve dynamically during a discharge, influencing key aspects of performance including energy confinement, stability, and fusion power production. Analyzing plasma performance during the pulse—rather than relying solely on post-pulse data—provides essential insights into transient phenomena, transport processes, and the interplay of heating and fueling. This in-pulse analysis is vital for guiding control strategies for sustained, high-performance fusion plasmas during an experimental session.
In this work, we demonstrate the usage of ParaView as a key visualization and data exploration tool for IMAS, the Integrated Modelling and Analysis Suite that ITER is using for all its processed data needs, to support both static and interactive visualization of plasma parameters. By embedding ParaView scripts and tasks directly into an IMAS workflow, we can enable the generation of detailed visual outputs—such as 3D renderings of magnetic flux surfaces, current and temperature profiles, and diagnostic signal mappings—at various stages of the analysis. In addition, we can also leverage ParaView to ensure that complex, high-dimensional plasma data can be explored dynamically rather than only through static plots, empowering researchers to uncover subtle features such as asymmetries, localized instabilities, and temporal evolutions that might otherwise be overlooked. Users can manipulate views, apply filters, and adjust color maps interactively to investigate the spatial and temporal structure of plasma events, providing timely feedback on the quality and relevance of the analysis results. In addition, ParaView's ability to handle large, multi-dimensional datasets is critical in the context of ITER, where vast amounts of data must be processed, visualized, and interpreted quickly to inform operational decisions and advance scientific understanding.
By integrating ParaView as a modular, scriptable actor, we ensure that visualization tasks can be executed in parallel with other analysis tasks without introducing bottlenecks. This integration facilitates a workflow where data exploration is not an afterthought but a core component of the analysis pipeline, supporting transparent, reproducible, and actionable plasma performance insights for ITER and future fusion devices.
Fusion devices such as ITER are expected to generate over one million sensor signals per discharge, each lasting 30 minutes or more. Identifying known patterns within these long time series is essential for understanding plasma behavior, but it poses significant computational challenges. In this work, we present a method for efficient pattern search in large-scale time series using FAISS, a high-performance library for similarity search. The technique involves a sliding window over each signal, transforming each window into a feature vector normalized to lie on the unit hypersphere. These vectors are stored in a FAISS index using cosine distance as the similarity metric. Once indexed, the system enables rapid retrieval of similar segments by comparing a known reference pattern against the database and selecting those below a predefined distance threshold. This approach has shown excellent performance, identifying target patterns within seconds across discharges longer than 30 minutes. The technique offers a practical and scalable solution for fast pattern retrieval in the massive, high-dimensional datasets expected from ITER and future fusion experiments.
EAST tokamak, one of the most important Magnetic Confinement Fusion (MCF) devices in China, provides an important experimental platform for the study of steady-state advanced plasma operation. Over sixty diagnostic systems on EAST tokamak provides huge amounts of multimodal diagnostic data about MCF plasma. Diagnostic data of EAST tokamak has the characteristics of volume, variety and velocity. In many cases, intelligent fusion data processing methods based on machine learning have advantages over traditional methods. This report reviews some recent progresses on intelligent processing of multimodal diagnostic data on EAST tokamak, including data cleaning, profile reconstruction, and spectral decomposition. To guarantee the availability and reliability of data source in MCF devices, Time-Domain Global Similarity (TDGS) method based on machine learning technologies is developed for automatic data cleaning. The performance of TDGS method on EAST POlarimeter–INTerferometer (POINT) system has reached 0.9871 ± 0.0385. Convolutional Neural Networks (CNN) and Back Propagation Neural Network (BPNN) are introduced into reconstructing electron density profiles from line-integrated density measurements of interferometers in EAST tokamak. The established CNN model can predict the probability distribution of density profiles accurately, fast, and robustly to noise and interference. Compared to the traditional Park-matrix method, the BPNN-based model demonstrates significantly faster performance and greater robustness against system noise, making it suitable for real-time control of density profiles. Moreover, an improved genetic algorithm is applied to decompose the scattering spectra of Collective Thomson scattering (CTS). This improved genetic algorithm with a new fitness function can obtain a more precise ion temperature from scattering spectra of CTS and does not rely on the measurement of other diagnostic systems, which has an extensive application prospect in data processing of CTS. Machine learning has played an important role in fusion data science, contributing to safe operation and physics discovery, and will play a more and more important role in the future fusion reactors.
Nathaniel Saura1, Daniel Iglesias1
1ITER Organization, 13067 Saint Paul Lez Durance Cedex France
In the context of ITER operations, numerical simulation plays a critical role in predicting the thermal behavior of plasma-facing components subject to intense radiative and nuclear loads. It generally requires heavy simulations and prevents from extensive scenario exploration. Developing surrogate models is an alternative to such approach and allow for fast solutions under different conditions. To this aim, we developed an end-to-end framework that starts from the CAD geometry of the Diagnostic First Wall (DFW) body and computes its thermal evolution given a set of input parameters, including both surface heat flux from photon radiation and volumetric nuclear heating due to neutron streaming within the DFW body. This framework embeds SALOME to automate the meshing of 2D planes of the DFW, sets the boundary elements and run a verified Finite Element solver named MKNIX* to compute the nodal temperature evolution on each 2D mesh.
In parallel, we adapted the porous media approach [1] to account for active cooling in the DFW body without explicitly meshing the complex pipe network. Instead, we compute an effective porosity based on the spatial density and the radius of the cooling channels and model the heat transfer coefficient of the coolant using its thermophysical properties along with flow parameters such as mean velocity and inlet initial temperature (considered constant at this stage). This leads to a localized thermal resistance, named porosity resistance, that extracts energy from the body. The method showed good agreement with full CFD simulations of a generic DFW. Moreover, it does not rely on manually tuned parameters, making it adaptable for other similar problems.
Future works will focus reconstructing the full 3D temperature field from a set of 2D-slice solutions. We plan to explore convolutional neural network-based interpolators for their flexibility, the possibility to penalize their training with physics laws and their fast inference. These conditions are pivotal to support thermal monitoring.
References
[1] McDermott, M et al., Nucl. Eng. and Design, 421, 113084 (2024),
*https://daniel-iglesias.github.io/mknix/
In modern fusion research, uninterrupted access to historical data is critical for thorough post-discharge analysis, precise experiment control, and robust machine health monitoring. The ability to efficiently retrieve, visualize, and analyze large volumes of time-series data plays a central role in improving operational reliability and supporting data-driven decision-making.
This work presents a fault-tolerant, scalable architecture for time-series data collection, storage, and visualization, specifically designed to address the demanding requirements of fusion experiments. The platform is built on TimescaleDB, deployed in a high-availability PostgreSQL configuration using Patroni for automated failover, HAProxy for connection routing, and Keepalived for virtual IP failover management. This setup ensures continuous availability and transparent recovery during node failures. The entire infrastructure is fully containerized using Docker and orchestrated with Docker Compose, with future extensibility towards Kubernetes for improved scalability and cluster management.
Grafana dashboards are integrated to provide dynamic and intuitive visualization of historical data streams, supporting interactive analysis across different timescales and sensor channels. Benchmarking results demonstrate up to a 97% improvement in query latency for historical data retrieval with HA TimescaleDB compared to standalone PostgreSQL, highlighting its efficiency for short-interval queries and diagnostic workloads. In addition, the architecture supports seamless failover, load-balanced querying, and container-native service discovery, making it suitable for long-duration experimental campaigns where reliability is paramount.
Overall, this architecture provides a reproducible and extensible foundation for resilient data infrastructure in fusion research. It not only addresses immediate challenges of data availability and performance but also establishes a pathway for integration with advanced features such as anomaly detection, predictive analytics, and natural language querying, enabling intelligent diagnostic capabilities for next-generation fusion devices.
This work explores the application of Convolutional Neural Networks (CNNs) for tomographic reconstruction of visible plasma radiation distribution at the GOLEM tokamak. The training datasets are generated from emissivity phantoms of the poloidal cross-section together with synthetic measurements from two visible cameras. CNNs are employed for their capability to capture local image patterns in the camera data and reconstruct complex radiation profiles. The study examines how the design of the training data influences model performance, with the aim of developing optimized strategies for accurate and reliable CNN-based tomographic reconstruction in plasma diagnostics.